
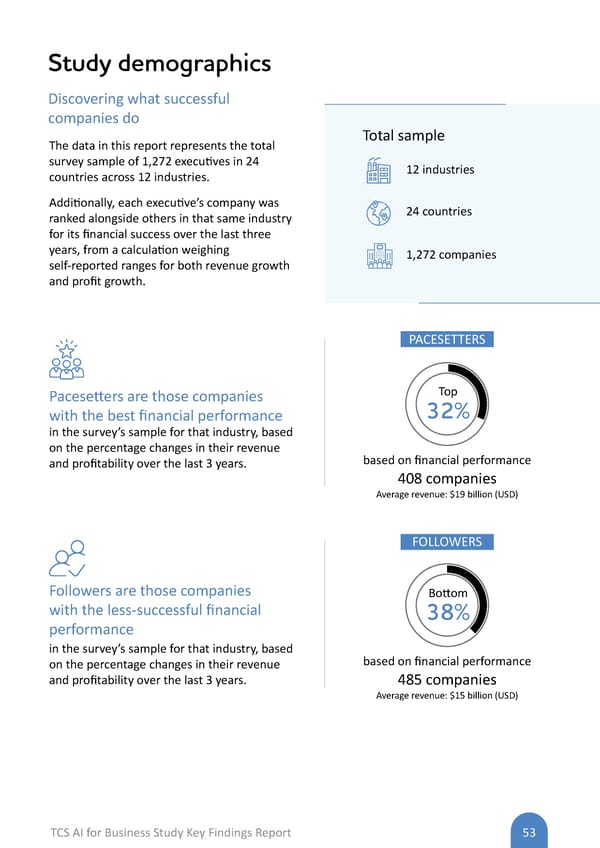
Study demographics Discovering what successful companies do The data in this report represents the total survey sample of 1,272 execu�ves in 24 countries across 12 industries. Addi�onally, each execu�ve’s company was ranked alongside others in that same industry for its financial success over the last three years, from a calcula�on weighing self-reported ranges for both revenue growth and profit growth. Pacese�ers are those companies with the best financial performance in the survey’s sample for that industry, based on the percentage changes in their revenue and profitability over the last 3 years. Followers are those companies with the less-successful financial performance in the survey’s sample for that industry, based on the percentage changes in their revenue and profitability over the last 3 years. Total sample 12 industries 24 countries 1,272 companies PACESETTERS Top 32% based on financial performance 408 companies Average revenue: $19 billion (USD) FOLLOWERS Bo�om 38% based on financial performance 485 companies Average revenue: $15 billion (USD) TCS AI for Business Study Key Findings Report 53
 AI Flipbook | TCS AI for Business Study: Key Findings Report Page 52 Page 54